

HR analytics in hiring means comparing what you knew at the interview with what happened after: who passed each stage, who accepted, who stayed and who performed. You’re not building a dashboard for its own sake. You’re checking whether your process picks people who work out, and whether it treats candidates from different groups the same way.
I interviewed job seekers at Walmart and then spent nearly three years helping rework how the company recruited. The problems we worked on were job-hopping and cost per hire, and the changes included virtual interviews and a new interview score sheet. That’s the angle here: analytics as a way to fix a hiring process you already run, not as a software category.
What HR analytics means in hiring
HR analytics is the practice of collecting and studying workforce data so you can make better people decisions. In hiring, you look at patterns across applications, interviews, offers, early turnover and performance, then change the step that’s causing trouble.
Say one department loses new hires much faster than another. Or people who looked great on paper keep struggling by month three. Analytics lets you move past a hunch about why. It doesn’t replace your judgment; it gives that judgment something to check against.
Who benefits? Hiring managers get stronger candidates, HR gets fewer bad hires, and candidates get a fairer shot, because a process that’s measured is harder to run on gut feel alone.
Eight hiring metrics worth tracking
Not every number deserves a chart. The useful ones connect to hiring quality, the candidate’s experience and what the hire costs you. Here are eight, with a plain way to calculate each. Pick the two or three that match the problem you actually have.
| Metric | How to calculate it | What it tells you |
|---|---|---|
| Time to hire | Days from a candidate applying to accepting the offer | Whether slow steps are losing you people |
| Cost per hire | Total recruiting costs in a period divided by hires in that period | What each hire costs, and which sources are expensive |
| Offer acceptance rate | Offers accepted divided by offers made | Whether pay, timing or the interview experience is costing you finalists |
| Early turnover | New hires who leave within a window you set (say 90 days) divided by all hires | Whether the job matched what the interview promised |
| Quality of hire | A combined score, such as first-review rating plus 90-day retention | Whether the process picks people who perform and stay |
| Stage pass rate | Candidates passing a stage divided by candidates entering it | Where candidates drop out, and whether the drop is even across groups |
| Interviewer score spread | Each interviewer’s average score compared with the panel average | Who rates too hard, too soft or inconsistently |
| Source of hire | Hires and quality of hire by job board, referral or other channel | Which channels bring people who last |
Quality of hire matters most, because it blends several signals: how new hires perform, how long they stay and how quickly they get up to speed. If you only track speed, you’ll hire fast and may regret it later. If you only track cost, you’ll pick the cheap channel even when its hires leave first.
Cost per hire was one of the problems I worked on at Walmart, and it’s tied to early turnover. Every person who quits in the first months sends you back to the start of the funnel, so a cheap hire who leaves isn’t cheap.
Check whether your interviews predict anything

Interviews still matter, but they aren’t proof of anything on their own. A confident speaker can impress a panel and still be the wrong fit, and a quiet candidate with exactly the right skills can get passed over for answers that weren’t polished enough.
Candidates notice this too. In a May 2026 r/interviews post titled “Job interviews are NOT accurate measurements of potential performance,” the poster described coworkers who interviewed badly but knew their stuff well, and the post drew 194 upvotes.
The research is more measured than that. A 2022 review in the Journal of Applied Psychology by Sackett, Zhang, Berry and Lievens concluded that earlier studies had overestimated how well many selection methods predict job performance, and revised the leading estimates down by .10 to .20 points. Even so, structured interviews ranked first among the selection procedures the authors reviewed. So the format of the interview matters more than whether you interview at all.
A structured interview asks every candidate the same questions and scores each answer against the same anchors. That’s what a score sheet does. Here’s what one row can look like:
- Question: “Tell me about a time a customer was upset with you. What did you do?”
- 1, weak: blames the customer or can’t give a real example.
- 3, solid: a real example, stays calm, fixes the immediate problem.
- 5, strong: a real example, fixes the problem, then changes something so it doesn’t happen again.
Once every interviewer scores this way, analytics becomes possible. Six months later, put interview scores next to first reviews and retention. Then check three things: whether the 5s outperform the 3s, whether any question predicts nothing, and whether one interviewer’s 4 looks like everyone else’s 2. The answers tell you which questions to keep and which interviewers need calibration.
Use the four-fifths rule on each stage
Analytics can also tell you whether a step treats groups differently. The federal Uniform Guidelines give a rule of thumb for this, known as the four-fifths rule. Under 29 CFR 1607.4(D), a selection rate for any race, sex or ethnic group that’s less than four-fifths (80%) of the rate for the group with the highest rate “will generally be regarded by the Federal enforcement agencies as evidence of adverse impact.”
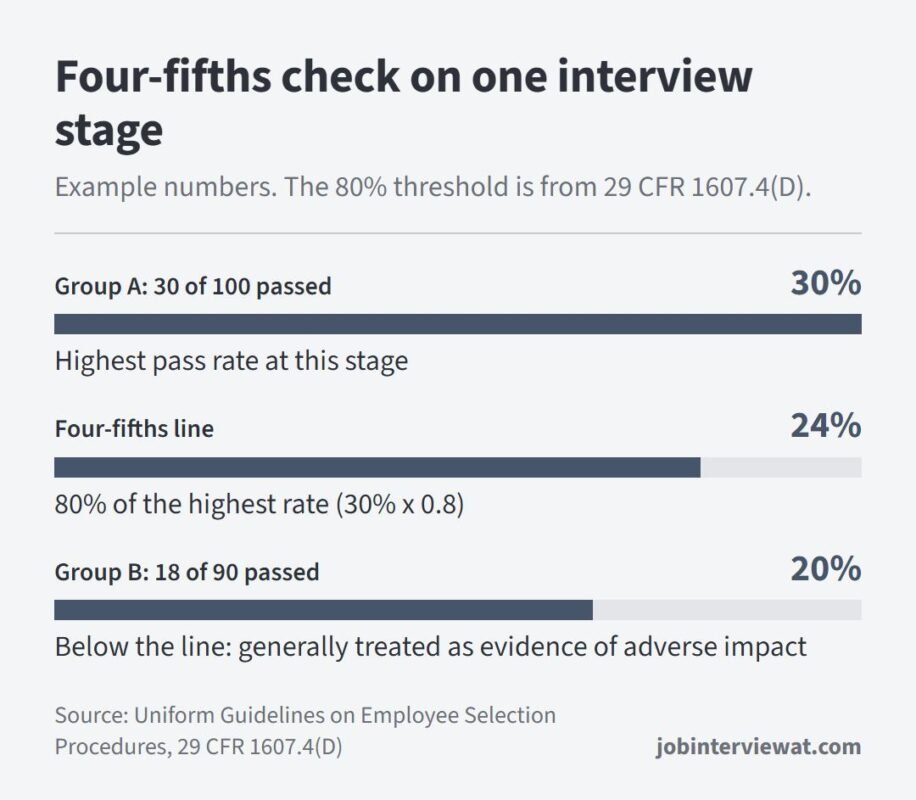
What does that look like in practice? Here’s the math with example numbers. At the first interview, 30 of 100 candidates in Group A pass, a 30% rate. In Group B, 18 of 90 pass, a 20% rate. Four-fifths of 30% is 24%, and 20% falls below it, so that stage would generally be treated as evidence of adverse impact.
Run this check on each stage, not just on final hires. A gap that shows up only at the phone screen points you to one step, and often one set of questions or one interviewer.
The rule has limits, though. The same section says smaller differences can still count as adverse impact when they’re significant, and a check on a handful of candidates can swing on one person. Treat a flag as a reason to look closer, and talk to employment counsel before you change a selection procedure because of it.
Early turnover: look at teams, not just candidates
When new hires keep leaving, the easy conclusion is that you hired the wrong people. The data often says otherwise.
In a June 2026 r/recruiting thread, a solo recruiter at a tech startup said new hires were being let go a few months in, sometimes as soon as 30 days. The top reply, with 166 upvotes, read:
“10 candidates is a lot, more likely your tech team is the problem”
– r/recruiting, June 2026 (166 upvotes)
That’s one thread, not a study, but it points to a check you can run. Split early turnover by team, hiring manager and start month. If exits cluster under one manager, or in the months when onboarding was rushed, the fix is on your side of the table. If they’re spread evenly, look at how the job was described in the posting and the interview.
Job-hopping was the other problem we worked on at Walmart, and this split is how you separate a candidate pattern from a workplace pattern. The candidate side of that question shows up in interviews as “why did you leave your last job,” and our guide to answering why you left your last job covers what interviewers are listening for.
Choosing HR analytics tools
Do you need software at all? Not if you hire a few dozen people a year; you can run every check above in a spreadsheet. Software starts to pay off when the data lives in several systems, such as your applicant tracking system, payroll and performance reviews, and pulling it together by hand takes longer than reading it.
Some companies use the best tools for HR analytics to track hiring funnels, compare candidate outcomes and measure what predicts long-term success. Before buying a platform, it helps to know how the review sites rank them; our guide to HR software review sites covers seven of them.
The right software depends on company size, hiring volume, the systems you already use and the metrics you want to track. If you’re comparing platforms on those points, HR.software says it uses AI guidance, expert input and scenario-based research across more than 350 tracked platforms, with guides by country and company size.
Whatever you use, check that it can export stage-by-stage pass rates by group. Without that, you can’t run the four-fifths check.
Common mistakes with people data
What goes wrong most often? Collecting everything with no question in mind. You end up with a lot of numbers and still miss the obvious. Start from a problem, then pull only the data that answers it.
The second is treating a pattern as proof. If your top performers share a trait, that doesn’t mean the trait caused their success. They might have had better managers, better onboarding or easier territories. A few more to watch for:
- Using incomplete data, such as interview scores that only half your interviewers filled in.
- Ignoring privacy: limit who can see individual records, and tell candidates what you collect.
- Measuring activity, like interviews held, instead of outcomes, like hires who stayed.
- Copying another company’s metrics without asking whether they fit your roles.
- Letting a score override the interviewer’s notes without asking why they disagree.
Start with one hiring problem
You don’t need an enterprise system to begin. Pick one hiring problem you genuinely want to solve: high turnover in the first six months, interview scores that seem random, or roles that take too long to fill. Then:
- Write the problem as a question, such as “Which stage loses the most candidates?”
- Choose two or three metrics from the table that answer it.
- Standardize interview scoring so the numbers mean the same thing across interviewers.
- Compare hiring data with outcomes at 90 days and six months.
- Review every quarter, and change one step at a time so you can see what worked.
The goal isn’t more charts. It’s a process that picks people who stay and treats candidates consistently, and that’s something you can show with your own numbers.
What this means if you’re the candidate
If you’re applying for jobs, companies that use HR analytics affect you even though you’ll never see their dashboard. A scored, structured interview rewards specific answers over charm, because each answer is marked against the same anchors as everyone else’s.
So prepare stories, not lines. Which story fits which question? For each common question, have one real example with what you did and what happened, ideally with a result you can name. In the score-sheet row above, the difference between a 3 and a 5 was a single extra step: what you changed afterward. Our guide to Walmart team lead interview questions shows how answers to scored questions are built.
Some employers now help you prepare. In a September 2026 r/corporate post, a software developer said their department started sending candidates the interview questions 24 hours ahead, then asks detailed follow-up questions to check the examples hold up.
If you get questions in advance, the follow-ups are where you’re scored, so know every detail of the stories you pick.
HR analytics FAQ
What is HR analytics in recruitment?
It’s using hiring data, such as time to hire, stage pass rates, offer acceptance and early turnover, to see which parts of your process work. The core check is whether interview scores line up with how hires perform and how long they stay.
What is the four-fifths rule?
It’s a rule of thumb from 29 CFR 1607.4(D). If one group’s selection rate is less than 80% of the highest group’s rate, federal enforcement agencies generally treat that as evidence of adverse impact. Smaller differences can still count when they’re significant.
How do you measure quality of hire?
There’s no single standard formula. A practical version combines a first performance rating with retention at 90 days or a year, then compare the score across sources, interviewers and roles.
Do small companies need HR analytics software?
Not to start. A spreadsheet with stage pass rates, interview scores and 90-day retention covers the basics. Software pays off once your hiring data sits in several systems you’d otherwise combine by hand.